Many of you may have read the bestselling book by Michael Lewis or seen the movie “Moneyball”that was based on the book. This is a true story about the very successful 2002 Oakland A’s professional baseball team. The team had been winners but was losing their key players and had very little money. Traditionally, the player selection process was to use a team of experienced talent scouts to qualitatively assess their observations, player information, and best human judgment to determine what players to seek and for what price. But the team had no money to bid for the consensus superior players that were recommended by the scouts.
The general manager did something very creative, very cost-effective, and hugely controversial. He brought in a smart computer nerd who was a baseball nut. The nerd crunched all of the statistical numbers about each player and combination of players. He did not program any human passions or judgmental preferences. Based solely on these statistical analyses, the manager assembled a productive, cost-effective combination of players. These new players, although statistically strong, had negative human biases attached to them, and these biases made them “cheap” in the baseball marketplace. Going against conventional wisdom is rarely a popular move. Of course, to the amazement of everyone (but the nerd), the team was hugely successful that year. And in the coming years, the nerd’s quantitative assessment process was copied by other baseball teams.
Our Investment Moneyball
Approximately 25 years earlier, a similar nerd-driven analytical process was taking roots in the stock selection business. When Gene Hoots and Tom Quinn began building our quantitative research system in the late 1970’s, we were only aware of two other firms who were building these fact-based analyses – Dean Lebaron at Batterymarch and Stan Calderwood at Trinity, both in Boston.
Our Fundametrics® system has a 30-year history of valuations, algorithms, correlations, and compounded weekly returns. The Fundametrics® research allows us to construct composite or multi-factor valuations for every stock in a relatively large universe. With our key decision-making composite, which is based solely on the statistical fundamentals, we narrow the universe of stocks down to a manageable list of a few buy candidates. This gives us a small fishing pond to work in.
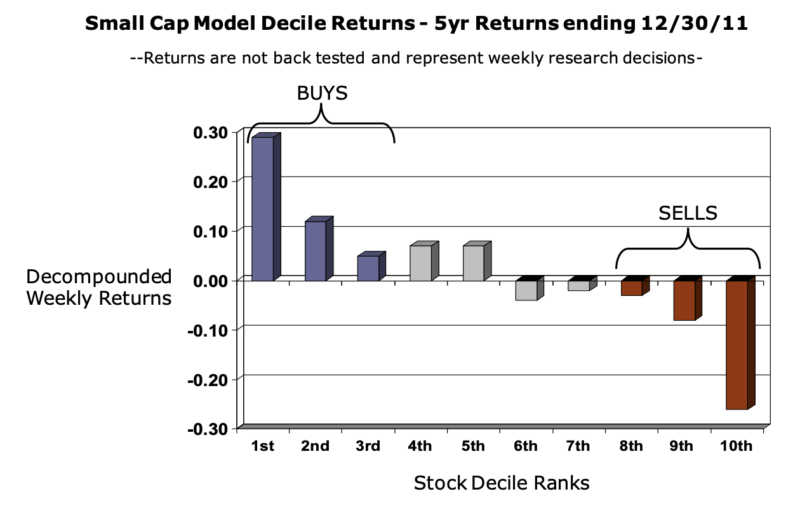
In the Fundametrics® system we give each stock a one-to-ten ranking based on their statistical fundamentals. The Buys, Holds and Sells are ranked 1-3, 4-7, and 9-10, respectively. Over the last 30 years, the step function pattern has been very consistent, with the one’s outperforming the two’s, the two’s outperforming the three’s, etc. throughout the deciles (see attached chart). Since we measure these deciles’ returns every week, we were confident that if we stayed in that small pond, we should be a winner over time. The Buy ranked stocks in our Fundametrics® research are not always the most popular among investors, but just like in Moneyball, they get the job done when there are few believers!
We are proud to have been pioneers with this more disciplined, unemotional, predictable, and cost-effective approach to building equity research and selecting portfolio holdings. We are even more proud of the 30-year returns that our Fundametrics® research has helped us to create.
On September 30, 1979, Gene and Tom formed an investment management partnership and began using this quantitative research system to make the buy and sell decisions for the Carolina Equity Fund (CEF). The CEF is an all-equity fund (limited partnership) that was created for us, some friends and family, and a few RJR executives. While we have closed the fund to new investors many years ago, we continue to manage it using the same research tool. From 9/30/79 to 1/31/12, the fund has an average annual return of 13.67%/year before fees and 11.82%/year after fees, compared to the benchmark Russell 2000 Value Index return of 10.59%[1].
Controlling Fear & Greed
When we took over the management of the R.J. Reynolds pension fund, our initial efforts were in hiring, monitoring and periodically terminating a large stable of outside investment advisors. We were solicited by the most highly respected investment professionals in the country, and we enjoyed the unique opportunity to listen to and learn from them. However, we became increasingly dismayed from what was said versus what was actually done with many of the investment firms we tracked. Many of the firms seemed very comfortable overriding the philosophical beliefs that had been expressed in our client meetings. Their emotions about the market and assumptions about their wisdom seemed to take precedence over any investment discipline, especially at times of extreme in the market. This conflicting behavior was being reflected in these managers’ weak returns.
In those early days, qualitative research and subjective judgment were essentially the determinants of a manager’s performance. The lack of quantitative analysis gave investment managers huge flexibility in the selection of stocks, sectors, styles, etc. As noted above, this flexibility resulted in a high level of poor and inconsistent performance. In other words, the confident application of human judgment, with all of the built-in biases, offered the opportunity to ignore or override the hard data. Again, at the extremes, be they the extremes of the market, a sector or a single stock, our experience has shown that there is little difference between the emotions of the man on Main Street and the professional on Wall Street – the emotions of extreme fear and greed weakens human judgment.
Qualitative research and human judgment are an important part of any investment research process. Our CornerCap investment committee performs qualitative research on our “Fundametrics® approved” stock selections and de-selections. Today, with the increased sophistication of computers and software and the increased cost of investment professionals, essentially all relevant investment shops use some level of automated modeling and analysis. And just as in baseball, a pure quantitative measurement of the facts will help investors to be more consistent and disciplined with their philosophical beliefs.
Building Fundametrics®
With our engineering, math and computer modeling backgrounds (yes, we had computers), we decided to build a stock research system that quantified the typical valuation and selection processes that we were observing in our role as the in-house managers at R.J. Reynolds. All of our outside managers had described to us the investment principles that were the drivers of their investment process. Our goal was to approximately measure what we had been sold by the investment manager against what they were actually doing, i.e. we wanted to quickly spot any conflicting behavior. We could accept periodic poor performance, so long as the manager stayed true to the investment process that we had acquired.
We built value-based models, such as price/earnings, price/book value, price/cash flow, etc. We built growth-based models, such as earnings momentum, change in forecasts momentum, change in ROE (return on equity), etc. And we built various other research “flavors” (GARP, risk, size/weighting, trading costs, etc.). We built these valuation models based on what the best-of-the-best were telling us were the long term factors for winning in the equity investment market. We still believe that managing a large pool of assets while having access to the best minds in the business was an unparalleled learning opportunity.
RJR senior management became increasingly aware of the real-world performance of the Carolina Equity Fund by the in-house investment group. In the early 1980s, they began replacing terminated outside managers with our in-house group. Our in-house portfolio grew to over $600 million. Our primary purpose for the Fundametrics® research quickly evolved from the monitoring of the outside managers to the direct management of our growing portfolio of in-house assets.
Owning the Future
We have continued to grow, explore, expand, test, enhance and measure the Fundametrics® research data since its inception over 30 years ago. As Gene and Tom have worked to transition the ownership of the firm, they have also transitioned to the next generation the passion and accountability for taking Fundametrics® research and investment returns to new levels.
Cannon Carr and Jeff Moeller lead our creative development for the quantitative research and the analytical interpretation of the results, and our Investment Committee consists of our seasoned Portfolio Managers and meets weekly. The “CornerCap of the Future” has grown our overall universe of stocks; segmented the universe by size; developed new discriminating stock valuations; enhanced our decision making composites; created sector-based sub-composites; built a “torpedo” warning signal; etc. For over 30 years, our Fundametrics® research has given us a powerful Proof Statement, facilitating the delivery of a consistent investment discipline over multiple generations of investment professionals.
Our mission is for CornerCap to deliver exemplary investment research, portfolio returns, and client service. We believe that this cannot be done without true “ownership.” It may start with the ownership of the business. However, our professionals also need to have ownership of a philosophy about investments and about service to others. Future generation owner/managers must also take mental and emotional ownership of our unique, key tools, such as the Fundametrics® equity research system. Make no mistake about it, a small group of committed people have always been the ones who have changed the world … not those stuck in the too-big-to-fail businesses.
[1] The Carolina Equity Fund (CEF) invests in equity securities of small-cap U.S. companies, which are currently defined by the advisor as stocks with market capitalizations under $2 billion. The stated return of the CEF includes the reinvestment of dividends and other earnings. The Russell 2000 Index measures the performance of the 2,000 smallest companies in the Russell 3000 Index. The Russell 3000 Index measures the performance of the 3,000 largest U.S. companies (based on total market capitalization), which represents approximately 98% of the investable U.S. equity market. Past performance is no guarantee of future results, and all investments are subject to risk of loss.
Performance Disclosure for CornerCap Fundametrics® Model Performance
This model performance information has been prepared by CornerCap Investment Counsel (“CornerCap”) and has not been independently verified. This is for informational purposes only and does not constitute investment advice.
The performance reflects CornerCap’s investment models as currently implemented using US equity models. The performance information reflects the re-investment of dividends and other earnings. Returns are based upon CornerCap’s security selections at the end of each week and are calculated by using equal weightings for each security within each model. CornerCap’s investment strategies involve a moderate level of portfolio turnover. Portfolio turnover affects transaction costs and lowers returns. Any level of portfolio turnover will have tax consequences for an investor.
The model performance results are subject to a number of limitations and do not reflect the results of any actual CornerCap client accounts, which may be materially different to those of the models. The performance of an actual client account will vary from CornerCap’s investment models for several reasons, including custodial costs and other fees, actual transaction costs in a client account being higher or lower than the model transaction costs, market conditions during trading, investment selection availability, and/or other factors. CornerCap calculates the model performance based on the weekly total return of equities provided by Compustat Data. However, actual client trades will be executed at the prevailing market prices, which will generally reflect a premium or discount. This variance may result in higher or lower actual account performance over time.
Past performance of CornerCap’s models is no guarantee of future performance, and CornerCap’s strategies, like most investment strategies, involve the risk of loss. You should not assume that future performance results will be profitable or equal to CornerCap’s past model performance. See CornerCap’s Form ADV Part II for a description of the risks associated with this portfolio and investing in equities. Different types of investments involve varying degrees of risk, and there can be no assurance that any specific investment strategy will be profitable. The use of CornerCap’s investment models and strategies may be appropriate for certain investors as part of their overall investment strategy. However, the use of investment models is not a substitute for personalized investment advice and investors should consult with an experienced financial advisor before investing or implementing any investment strategy.