Fundametrics® Smid Cap Equity
Q3 2020 Performance Summary and Observations
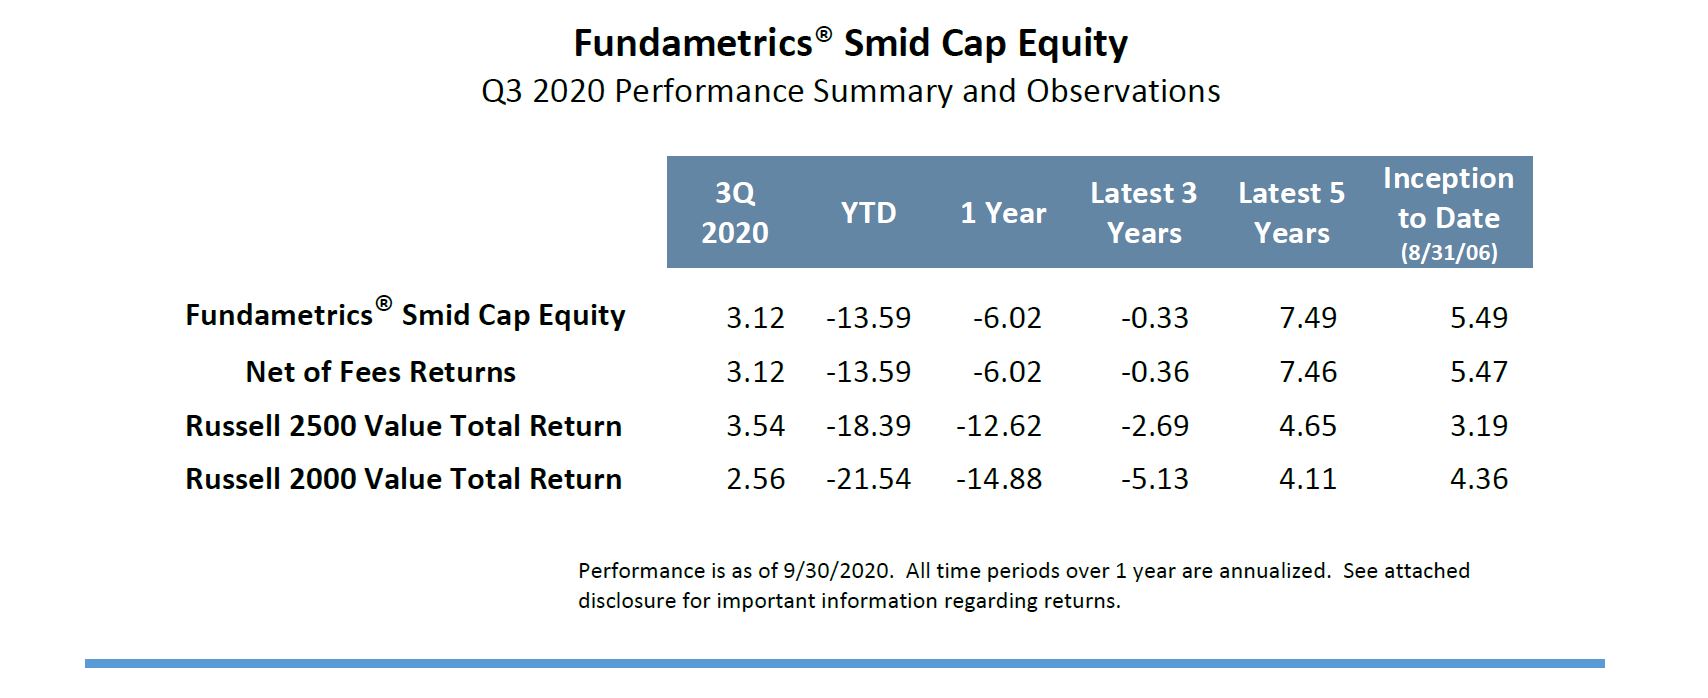
- The Fundametrics® Smid Cap Value strategy returned 3.12% for the quarter vs. the Russell 2500 Value index return of 3.54%.
- The winning profiles this quarter were stocks with: 1) the highest short interest, highest beta, weakest profitability, and highest debt balances—stock characteristics we put in the highest risk category. And, 2) the highest forecasted earnings growth and price momentum—basically the pure growth stories. The models detected a high probability of heavy short-covering this period.
- These trends worked against the Fundametrics research process. Sell-rated stocks in the model were heavily skewed toward companies with poor quality metrics, and pure growth with expensive fundamentals; they beat the Buys and Holds by 171 bps. 61.5% of the companies in the Alpha Composite sell group have negative free cash flow. That number jumps to 78.7% for the 10th decile alone which was the best performing.
- The rebound in higher risk companies negatively impacted our Financial Warnings Overlay. Some of the risk metrics within the Overlay are dynamic, and their scores were reduced during the quarter, but it had little impact. “Buy” rated stocks that failed Financial Warnings outperformed the “Safe” to purchase group by 732bps.
- The setup for Value continues to look favorable as small cap valuations are historically attractive, both in absolute and relative to large-cap equities. In corroboration, key indicators in our broader models show opportunities in Value.
Contact Derek Tubbs at CornerCap Institutional for the full report: 404-445-5117.
Access to full report DISCLOSURES.